| |

|
| |
| HCP Engagement |
| HCP walled gardens compared |
| Source: LiveWorld |
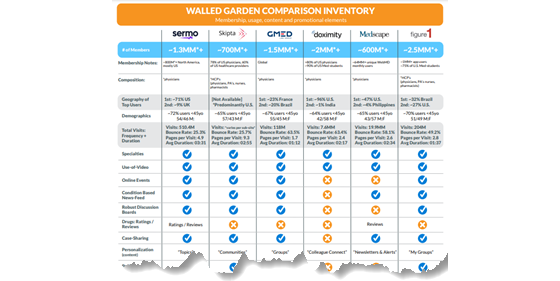
LiveWorld's Chief Medical Officer, Dr. Umar Siddiqui, has compiled a comparison of the different HCP-only social platforms. As a doctor he has access to these "walled gardens" and provides an insider's look into their functionality. |
The 3-page PDF includes this comparison chart with the functionality of each platform compared. |
|
|
Image adapted for email from LiveWorld source
|
| |
In this chart is a comparison of membership and usage. Unfortunately, we aren't provided with a methodology for these numbers. That said, they are better than nothing so we charted the different values and ranked the "winners." |
|
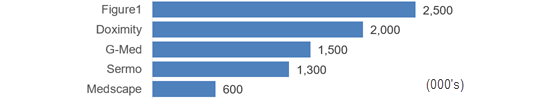
Membership
|
| |
Interestingly, the lesser-known Figure1 (the Instagram for doctors) leads here. The platform has a lot of medical students and includes nurses and pharmacists. |
|
|
Chart created from data in LiveWorld report
|
| |
|
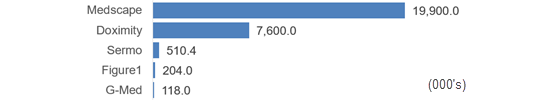
Medscape Trounces the Competition in Visits
|
| |
Medscape trounces the competition in visits while having the lowest registered members. How does it do this? By not strictly being a "walled garden." |
The site includes some medical news in front of the login and only requires that for more in-depth interactions. |
|
|
Chart created from data in LiveWorld report
|
| |
As a site that requires a login, Doximity makes a very strong showing. |
|
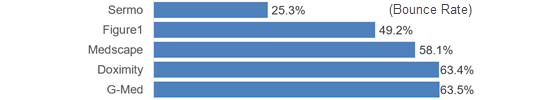
Bounce Rates and Time on Site Favor Sermo
|
| |
Sermo has fewer US doctors than Doximity (it is global while Doximity is US-based) but it has a great showing for bounce rates (low) and time per visit (high). |
|
|
Bounce rates, chart created from data in LiveWorld report, lower is better
|
| |

|
|
Time on site, chart created from data in LiveWorld report
|
| |
This little summary is a worthwhile download but we wish we knew where the author got the traffic data. |
—
Read the full story from LiveWorld |
| |
|
|
|
|
| |

|
| |
| Media |
| Ad benchmarks! Not for pharma... |
| Source: DISQO |
Pharma marketers often want to compare themselves to non-pharma to see where they stand. Thanks to some consolidated data from Disqo now they can. |
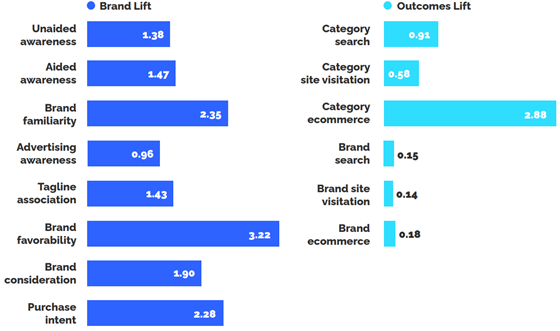
Disqo took advertising results data such as brand favorability and averaged them across multiple categories (almost certainly not including pharma). This chart shows the percentage lift across different measures. |
|
|
Image adapted for email from DISQO source
|
| |
Brand metrics were strongest but the more action-oriented ecommerce was high as well. |
|
Creative Matters
|
| |
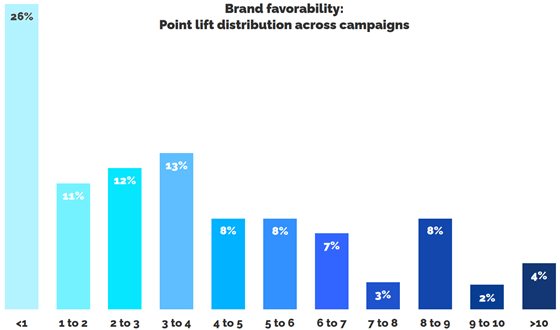
The report digs into the Brand Favorability metric to look past the average of +3.22 percentage points. Here, we see that a quarter of all campaigns have less than 1% lift in this metric. |
|
|
Image adapted for email from DISQO source
|
| |
Meanwhile, 24% get 6 or more points of lift. There is no analysis of the individual campaigns but one can imagine that they have much better creative than the lowest 26%. Your creative matters, don't stifle it with budget cuts and short timelines (too much soapbox -Ed.). |
—
Read the full story from DISQO |
| |
|
|
|
|
| |

|
| |
| Market Research |
| Video increasing, email dominant in marketers' mix |
| Source: Salesforce |
Salesforce's 8th State of Marketing report uses survey results from 6,000 global marketers to identify trends. Interestingly, pharma marketers are specifically excluded from the cohort: |
Healthcare (not including life sciences and biotechnology) ... 6% |
| |
This may indicate that Salesforce sees pharma marketers as significantly different from the mainstream. This is something that we already knew but it's interesting to see Salesforce picking up on it. |
|
Video Increasing
|
| |
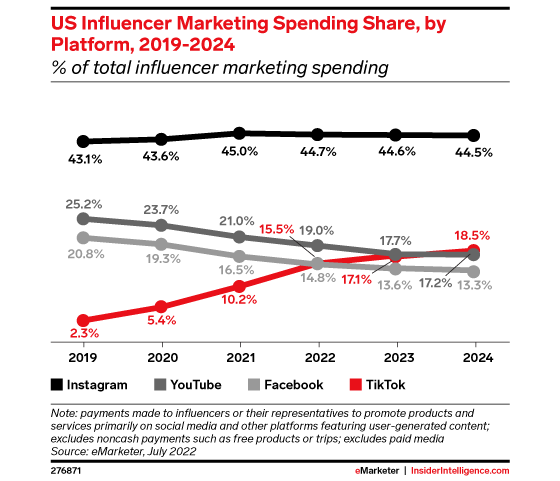
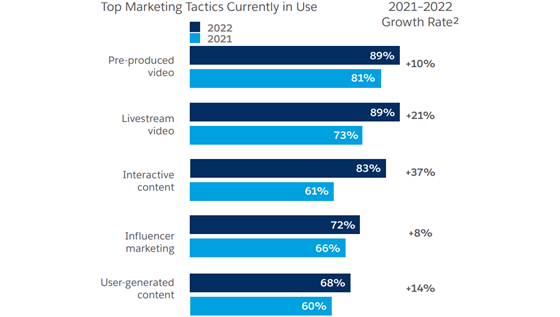
In the chart featuring top growth areas for marketers we see that video takes the two top spots for usage. Also included on the list are influencers and user-generated content showing how these interactive channels are increasing in importance. |
|
|
Image adapted for email from Salesforce source
|
| |
|
Email Still Dominates
|
| |
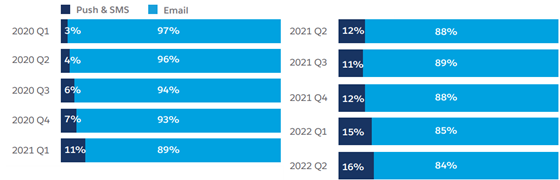
Sometimes the story is that there is no change. While marketers might talk about shiny objects all the time, email continues to be the workhorse of personalized messaging. |
|
|
Image adapted for email from Salesforce source
|
| |
|
Web3 Still in Planning
|
| |
97% of marketers either have or plan to have a Web3 strategy. As a reminder Web3 is based on blockchain identification and enables more decentralized interactions, it's not just the metaverse or NFTs. |

|
|
* this item is actually "Don't know" but we felt this was more fitting
|
| |
51% have a Web3 strategy they say. Many of these might be summarized as "wait for Web3 to become viable." Pharma marketers shouldn't feel like they are missing out yet. However, let's keep an eye on those technologies, they aren't going away. |
—
Read the full story from Salesforce |
| |
|
|
|
|
| |
|
| |
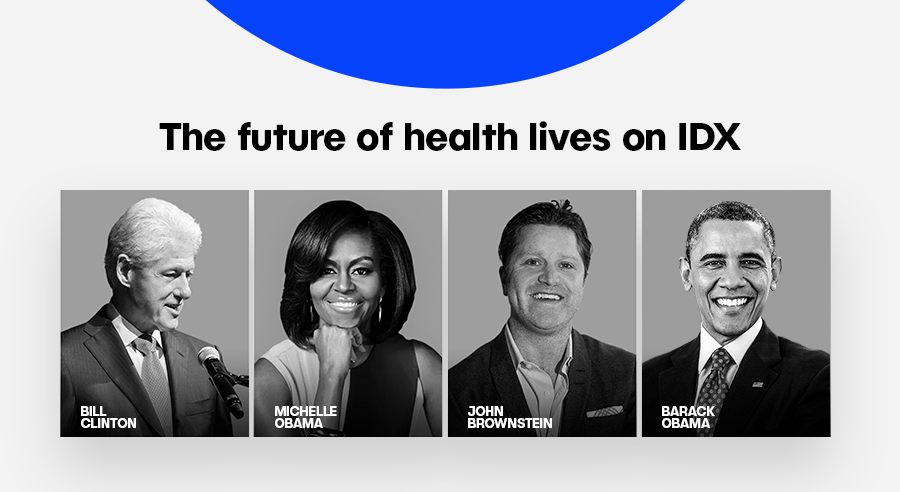
| Building a PSP With the Future in Mind |
|
|
A recent systematic review showed that 64% of PSPs report at least one significant positive clinical outcome for patients taking their product … is your PSP generating RWE? Download this POV to find out about designing new and existing patient support programs (PSPs) to generate outcomes and other key data across the patient journey. |
| |
|
Download POV
|
|
|
|
|
| |

|
| |
| AI in Health |
| Microsoft adding AI to search engine Bing |
| Source: Reuters |
It is being reported that Microsoft is looking to integrate the AI that runs ChatGPT into the Bing search engine. This may signal that the company is looking to provide a more conversational interface to the tool as it tries to compete with Google. |
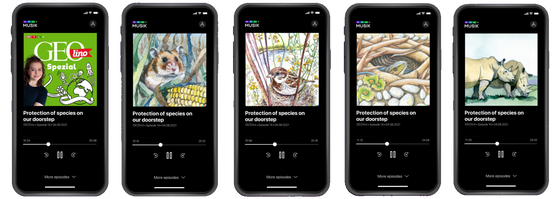
This isn't the first announcement of the company integrating AI into Bing. Back in October they announced that they would integrate DALL-E into something called "Image Creator" in the search engine. One use case for the tool was the creation of unique thumbnails for repetitive images such as chapters in a podcast. |
|
|
Image adapted for email from Reuters source
|
| |
These stories highlight how search engines are being pushed to be more interactive as Gen-Z heads towards tools like TikTok for search. |
—
Read the full story from Reuters |
| |
|
|
|
|
| |
|
|
| |

|
| |
| Mobile |
| Video takes over the small screen |
| Source: data.ai |
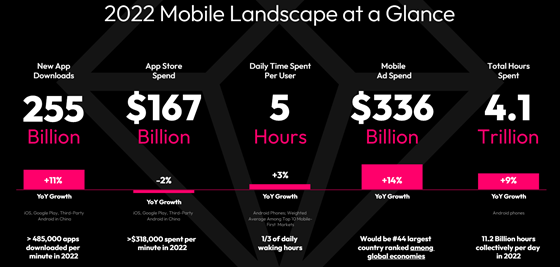
Data.ai has released their State of Mobile 2023 and it shows just how massive video has become. First, however, the top-line numbers. They show that hours spent continues to rise on mobile. |
|
|
Image adapted for email from data.ai source
|
| |
|
Hours Continue to Rise
|
| |
This chart is total hours by country so in some ways it is just a population count. Regardless, it shows how mobile hours are rising almost everywhere. Note the scale change between the two charts, 0.2T to 200B. |

|
|
Image adapted for email from data.ai source
|
| |
|
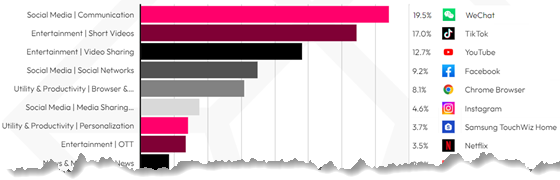
Chat First, Video Second
|
| |
The number one use case for mobile devices is communications with WeChat the top consumer of hours (we're not sure if the built-in apps are included in this data, we suspect Messages on Android and iOS are actually the top). |
After chat, however, video takes the next two slots. |
|
|
Image adapted for email from data.ai source
|
| |
|
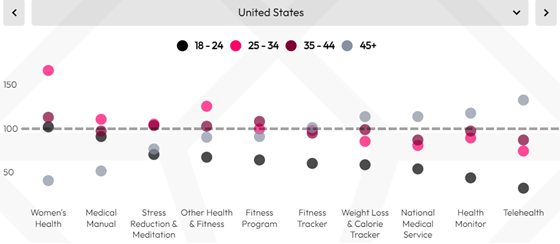
Telehealth Dominated by 45+
|
| |
Older demographics can use technology too, when they need to. When Data.ai broke down health apps by type and age-group the 45+ cohort dominated telehealth. The 25-34 group dominated Women's Health which likely includes fertility apps. |
|
|
Image adapted for email from data.ai source
|
| |
Data from the USA is shown, other countries can be selected from the Data.ai interactive website. |
—
Read the full story from data.ai |
| |
|
|
|
|
| |
|
| |
| Your search for thought-provoking perspectives starts here. |
|
|
Successful people stay in the know. Articles, video interviews, POV papers—IDX has what you need to stay on top of the fast-moving science industry. Sign up for exclusive content you won’t find anywhere else. |
| |
|
Join today
|
|
|
|
|
| |
|
|
| |
| AI in Health |
| OpenAI considering going public |
| Source: Reuters |
OpenAI, creator of ChatGPT, is looking at tendering an offer to go public and could be looking at an initial amount of $300 million that would value the company at $29 billion. |
The firm expects business to surge as it pitched to investors saying the organization expects $200 million in revenue next year and $1 billion by 2024 |
| |
—
Read the full story from Reuters |
| |
|
|
|
|
| |

|
| |
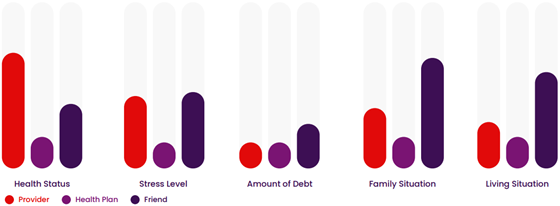
| Trust |
| Health insurers not trusted with data |
| Source: Virgin |
It's not news but it reinforces what we know: Health insurance companies are not trusted. When it comes to health information roughly 67% (eyeballed from the chart) would tell their provider but few would voluntarily tell their insurer. |
|
|
Image adapted for email from Virgin source
|
| |
Friends win in a couple of categories but by and large this report on social determinants of health show they are kept quiet by patients. |
—
Read the full story from Virgin |
| |
|
|
|
|
| |
|
|
| |
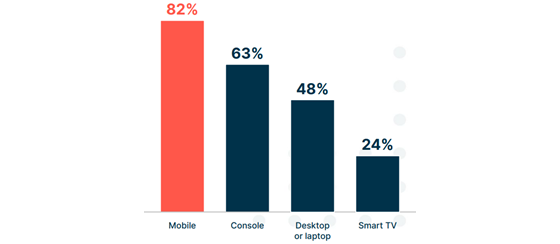
| Media |
| Gaming is more than "hard core" |
| Source: IAS |
When most marketers think "gaming" they think of younger people playing on a console or PC. This is no longer true, mobile is the number one gaming platform and has been for a while. |
|
|
Image adapted for email from IAS source
|
| |
Gamers are ok with ads, as long as they don't get in the way of gameplay. |
 |
69% of gamers are open to in-game advertising as long as the ads do not disrupt the gaming experience |
|
61% of gamers prefer to see ads that are related to the content of the game they are playing |
|
57% of gamers are likely to purchase from a brand whose ads are relevant to the content of the game they are playing |
|
| |
—
Read the full story from IAS |
| |
|
|
|
|
| |
|
|
| |
|
|
| |
|
|
| |