| |

|
| |
| HCP Engagement |
| 99% of HCPs on social |
| Source: Sermo |
A new report from Sermo looks at physicians' personal and professional usage of social media. The company gathered insight from member physicians using their on-platform polls and RealTime surveys. The results were from 13 countries globally and the numbers vary by question (see the report for "n" values). |
Wire readers will see the issue here immediately. This report suffers somewhat from selection bias as all the respondents are on Sermo. Still, it's valuable to see what these HCPs say about social media. |
|
99% on Social for Personal Reasons
|
| |
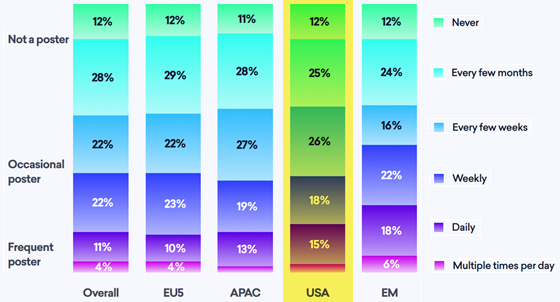
Respondents to the Sermo questions pretty much were all using social platforms for personal reasons. These physicians are on for reasonably substantive amounts of time with 60% over an hour or more. The US data were: |

|
|
Chart created from data in Sermo report
|
| |
This highlights a huge opportunity for marketers who can target HCPs on public social platforms to get content in front of them. |
|
63% Active in Private Specialty Groups
|
| |
When asked if they post in "private specialty groups" most respondents were fairly active which shows a high level of engagement. We interpret this as part of the public social questions rather than professional use. |
|
|
Image adapted for email from Sermo source
|
| |
|
Still a Facebook-First World
|
| |
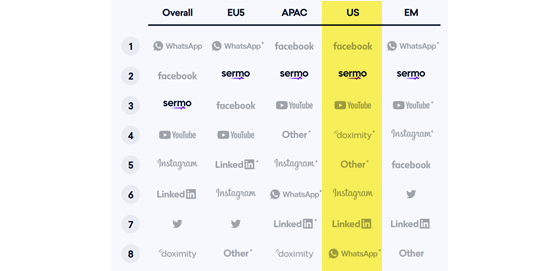
Looks like physicians in the US are similar to the population in general. They use Facebook the most. On this chart Sermo makes a strong showing but we do need to remind readers of the selection bias in this data. |
|
|
Image adapted for email from Sermo source
|
| |
|
Pharma Content All About Data
|
| |
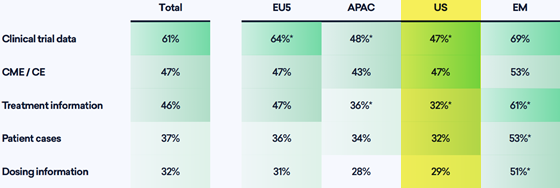
When asked what data they want from pharma, relevant respondents say data and education first. |
|
|
Image adapted for email from Sermo source
|
| |
This report from Sermo has interesting data on every page and gets the much-coveted "Must Download" rating from the Klick Wire (maybe we should just make that a thing -Ed.). Grab your own copy for more insights such as the credibility of professional platforms (spoiler: it's high). |
—
Read the full story from Sermo |
| |
|
|
|
|
| |

|
| |
| Social Media |
| Figure 1 hits 100,000 cases |
| Source: Figure1 |
The "Instagram for Doctors" has hit 100,000 cases and we reached out to the folks there for some insights into how these cases are working for members. |
|
Sponsored Cases in Top 5
|
| |
Two of the top five cases for engagement were sponsored content. It looks like the HCPs on Figure 1 are welcoming of pharma materials. |

|
|
Chart created from data supplied by Figure1
|
| |
|
Platform Education Generates Knowledge Lift
|
| |
Case based quizzes help HCPs get more knowledge about a topic. The knowledge lift seen across a few examples is impressive: |

|
|
Chart created from data supplied by Figure1
|
| |
It would be great to get some more audience and engagement data but you can always head over to Figure1 and reach out. A final finding from the good folks there: |
80% of HCPs surveyed post sponsored content campaigns said they are more prepared to identify a specific condition. |
| |
—
Read the full story from Figure1 |
| |
|
|
|
|
| |

|
| |
| Connected TV |
| CTV ads drive patient behavior |
| Source: DeepIntent |
DeepIntent worked with LG on a study that looked at how connected TV viewers perceive pharma ads. |
|
The Audience Doesn't Understand CTV
|
| |
First, it seems that the American public doesn't really understand when they are using CTV. When asked where they watched their favorite shows, 96% said cable or satellite but LG data from its TVs showed a much lower number: |

|
|
Image adapted for email from DeepIntent source
|
| |
|
Pharma Ads Have an Effect
|
| |
Other data in the press release shows that the audience does seem to take action on pharma ads: |
 |
64% of connected TV (CTV) watchers prefer to see ads than pay more for content |
 |
65% say targeted ads improve their experience |
 |
57% say CTV ads are more relevant than linear TV ads |
 |
42% rate the relevance of the pharma ads they see as poor or very poor |
 |
30% of people feel pharma ads provide helpful information to someone in their household |
 |
27% have spoken to a doctor about a medical treatment after learning about it through an ad |
|
| |
—
Read the full story from DeepIntent |
| |
|
|
|
|
| |

|
| |
| Building a PSP With the End in Mind |
|
|
Studies show that PSPs can improve clinical and economic outcomes...is your PSP being leveraged to the fullest? Download this POV to find out more about how to get the competitive edge with your PSP and make the most of your investment. |
| |
|
Download POV
|
|
|
|
|
| |
|
|
| |

|
| |
| Market Research |
| Know your data or your analysis could be off-base |
| Source: SortList |
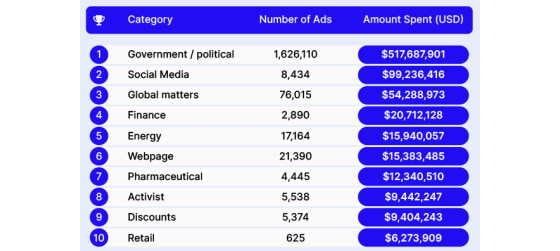
The folks over at SortList, which seems to be a small digital shop in the UK, posted a blog about Meta advertising. They gathered data from the Meta Ads Library Reporting tool and got this list of top "industries" from the US: |
|
|
Image adapted for email from SortList source
|
| |
They clearly position this as all advertising: |
We looked at the Meta advertising library’s information on Meta adverts since November 2018, to discover which companies have spent the most money on advertising in the UK and in the US. |
| |
Unfortunately for them, and MediaPost who repeated the information, the Meta Ads Library reports on only a subset of all ads: |
 |
Current ads running in market |
 |
Ads on sensitive subjects listed as "social issues, elections or politics" |
|
| |
So, you see the issue. Government didn't spend the most with a measly $517 million, they would be dwarfed by CPG led by P&G. The "pharmaceutical" line is mainly PhRMA as it runs political and social content. Some pharma companies are in the database for social posts as well but at very low numbers compared to their brand spends. |
The moral of the story? Know where your data comes from and the limitations on said data. Otherwise your analysis could be wildly inaccurate. (This story is a bit salty, but accurate so I'll allow it -Ed.) |
—
Read the full story from SortList |
| |
|
|
|
|
| |
|
|
| |
|
| |
| Registration is live! |
|
|
Be part of this exclusive, once-in-a-lifetime opportunity and join an intimate conversation with President Barack Obama, industry leaders, top scientists, and world-class performers.
Registration is limited. Apply now to attend. |
| |
|
Apply Now
|
|
|
|
|
| |

|
| |
| Influencer Marketing |
| No one knows much about the nascent influencer market |
| Source: Media Monks |
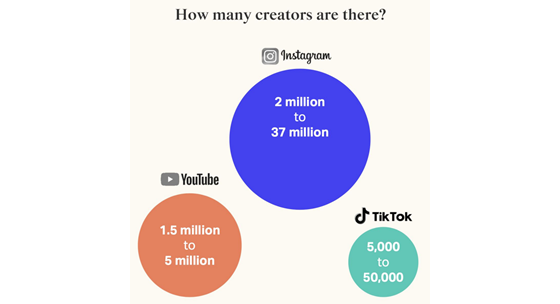
That headline is a bit salty, so let's explain it. A recent influencer marketing report said this: |
Combining the estimated range of data for TikTok, Instagram, and YouTube leads to a total range estimation of 3.5 million to 42 million. |
| |
|
|
Image adapted for email from Media Monks source
|
| |
A range of over 10x low to high. If you don't know, just say so. |
This estimate highlights how specialized marketers need to be to take advantage of influencer voices. There are most certainly influential voices for any given health condition, but the number and volume of these voices will vary greatly. |
|
Think About Interactive Social as Experiential
|
| |
This report also talks about Clubhouse as if it is still a thing. The app still runs but according to Wired the launch (when invites were no longer needed) didn't spark much excitement. |
|
|
So, for the metaverse, games, live group chats, and other interactive offerings marketers should adopt the experiential mindset. These more transient experiences are different from traditional social media that has a much longer tail. |
—
Read the full story from Media Monks |
| |
|
|
|
|
| |

|
| |
| Digital Platforms |
| Chatbots are terrible, voice in demand |
| Source: Voicebot.ai |
This story is based on a webinar put on YouTube on voice and text chatbots. Mainly voice since this is from Voicebot.ai. |
|
Top Frustrations with Chatbots
|
| |
Chatbots are seen as a blockage rather than a help in many if not most cases. When asked about the top frustrations with these technologies. Notice that the top three items are about the quality (or lack thereof) of the information coming back from the chatbot: |

|
|
Chart created from data provided in webinar
|
| |
|
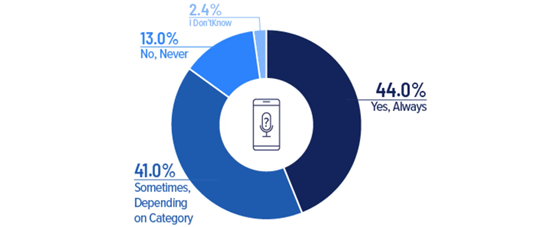
85% Expect Voice
|
| |
When asked if voice interfaces are expected, the vast majority said yes, at least in some apps. |
|
|
Image adapted for email from Voicebot.ai source
|
| |
|
Skews Older
|
| |
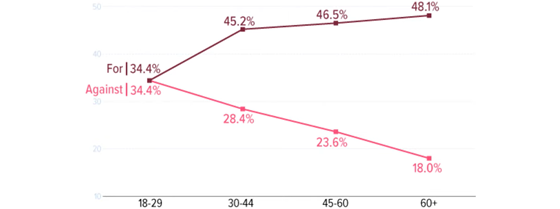
The most counterintuitive finding in the webinar is that older users are more likely to want voice interfaces. The presenters posit that perhaps it is because the younger users are more comfortable with their phones' keyboards etc. |
When asked if they were for or against voice interfaces, here's what different age groups said: |
|
|
Image adapted for email from Voicebot.ai source
|
| |
If you're interested in voice interfaces or chatbots put this webinar on over lunch and tune in. |
—
Read the full story from Voicebot.ai |
| |
|
|
|
|
| |
|
|
| |
|
|
| |
|
|
| |
|
|
| |