| |

|
| |
| Insights |
| Trust comes from PCP |
| Source: Dentsu |
A new report by Dentsu polls 1,000 Americans for their opinions about healthcare and pharmaceuticals. |
|
All About the HCP
|
| |
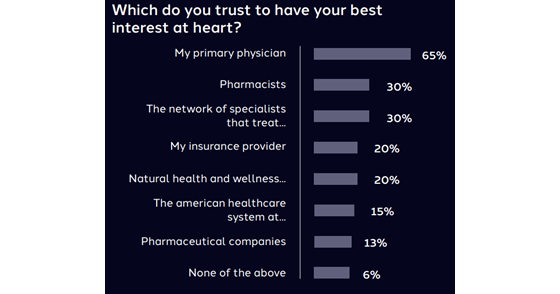
It's not surprising to see, but we want to highlight that the only group that got more than 50% with patients re: trust is the primary physician, even specialists were down at 30%. This question is asking who has the patient's best interests at heart rather than do you trust the advice. It shows the only relationship with high trust is with the primary physician. |
|
|
Image adapted for email from Dentsu source
|
| |
|
Influence Follows Trust
|
| |
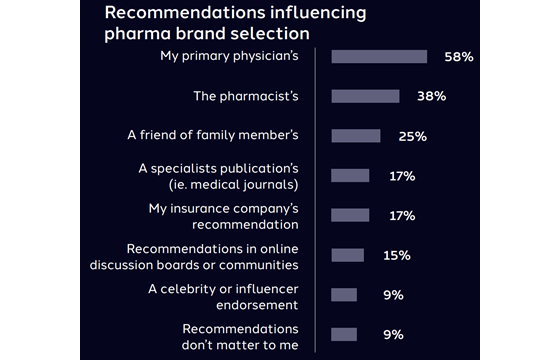
Here we see that the sources of influence for a patient follow their perceived trust pretty well. |
|
|
Image adapted for email from Dentsu source
|
| |
We assume it's a "friend or family member" in the above chart, otherwise that's a bit too specific. |
|
Give Me the Facts
|
| |
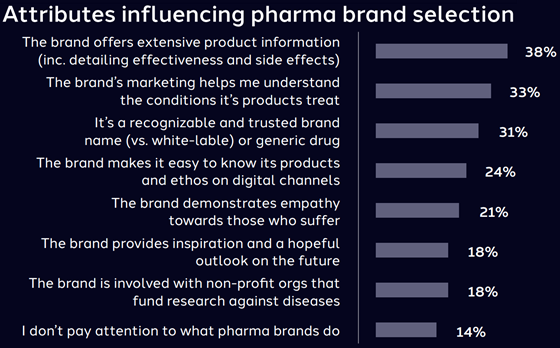
This next chart has low values across the board so we're not sure what to make of that. Regardless, in terms of attributes patients are looking for in therapy information it was facts and safety information at the top of the list. |
|
|
Image adapted for email from Dentsu source
|
| |
This report has a lot of data included. We wish they had charted more of it for easier scanning but it's still a good source of patient insight. |
—
Read the full story from Dentsu |
| |
|
|
|
|
| |

|
| |
| HCP Opinions |
| 71% of physicians don't have enough time for SDOH |
| Source: Physicians Foundation |
The Physicians Foundation is running a series of three reports in the series "2022 Survey of America’s Physicians." The first examines the current impact of social drivers of health (SDOH) on physician practice. |
|
SDOH Moral Jeopardy Hurting HCPs
|
| |
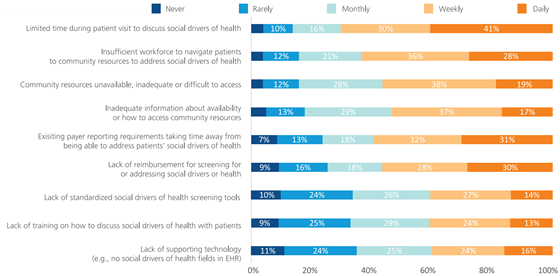
This chart is hard to read at email scale, but 71% of physicians say they "experience feelings of stress or frustration" weekly or more often because they have limited time to help patients with SDOH. |
|
|
Image adapted for email from Physicians Foundation source
|
| |
|
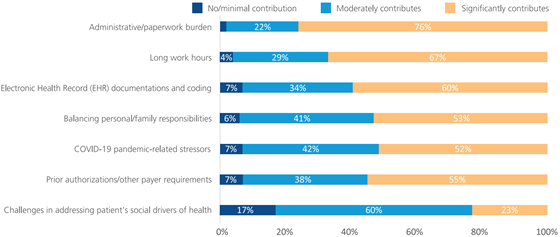
Physicians Hate Paperwork
|
| |
Administrative overhead is the bane of HCPs lives. Here 76% of respondents say admin burden "significantly contributes" to feelings of burnout. |
|
|
Image adapted for email from Physicians Foundation source
|
| |
This report doesn't directly look at HCPs work with pharma companies but it is important reading for marketers to understand how the rest of their environment is burning them out. |
—
Read the full story from Physicians Foundation |
| |
|
|
|
|
| |
|
|
| |
|
| |
| Prepare your PSP for the Future |
|
|
The industry invests $14 billion per year on patient support services… is your investment paying off? Download this POV to find out more about how to empower your PSP to generate important outcomes evidence and ensure you are realizing the full potential of your investment. |
| |
|
Download POV
|
|
|
|
|
| |
|
|
| |
|
|
| |

|
| |
| mHealth |
| Show me the money |
| Source: JAMA Network |
A new paper in the Journal of Medical Internet Research (JMIR) shows that younger patients will respond to an exercise program with these parameters: |
 |
Monetary rewards for participation |
|
Text message reminders to participate |
|
|
|
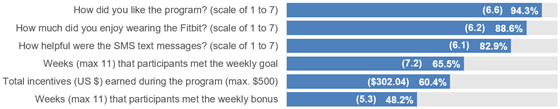
| |
When asked how they liked the program, the results were positive. While these measures really shouldn't be on the same chart as they are very different we did it anyway and show the absolute value plus the percent of scale: |
|
|
Image adapted for email from JAMA Network source
|
| |
The results were positive: |
Across the 12-week study, there were significant improvements in tracked daily active minutes (P=.006) and steps (P<.001) and significant pre- to posttest improvements in body fat percentage (P=.04). |
| |
—
Read the full story from JAMA Network |
| |
|
|
|
|
| |

|
| |
| CRM |
| Pharma top B2B content consumption growth |
| Source: NetLine |
Netline released a report on its system's usage by B2B marketers and content consumers. For this story remember it's about B2B ... the reason will become apparent in a moment. |
|
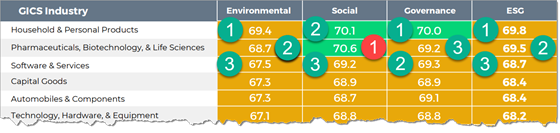
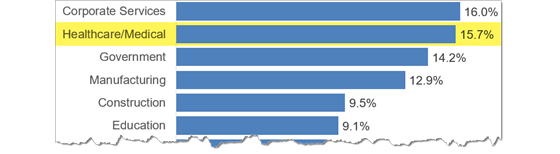
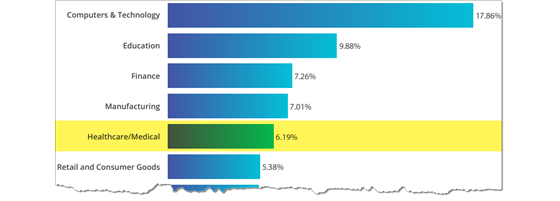
Pharma Top Industry
|
| |
Pharma and biotech is the top industry for B2B content growth with 22.42% more likely to consume YOY according to the NetLine report. The Healthcare industry group as a whole was number two right behind Corporate Services: |
|
|
Image adapted for email from NetLine source
|
| |
|
Total Content Middle of the Pack
|
| |
While our industry grew a lot, let's be clear, we're middle of the pack in terms of total content consumption: |
|
|
Image adapted for email from NetLine source
|
| |
|
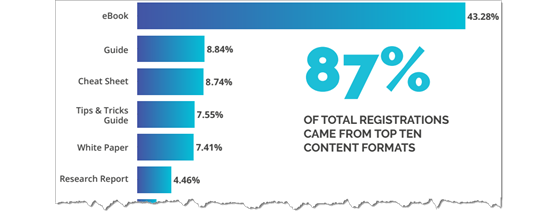
Readers Crave Depth
|
| |
The eBook crushed other formats, including reports. If your audience craves real knowledge, call your report an eBook (opportunistic, but I like it -Ed.). |
|
|
Image adapted for email from NetLine source
|
| |
|
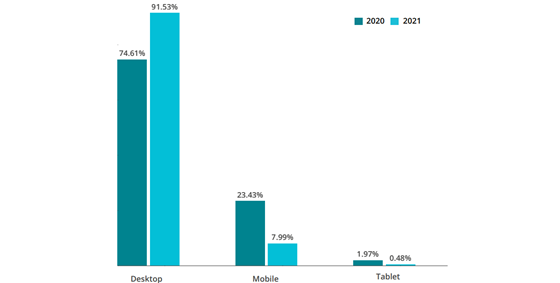
Desktop Crushes Mobile
|
| |
This is why context matters. For B2B content consumers, who obviously are doing a lot of their research during work hours, desktop absolutely crushes mobile: |
|
|
Image adapted for email from NetLine source
|
| |
For marketers looking to appeal to B2B audiences this is a great report ... I mean eBook. |
—
Read the full story from NetLine |
| |
|
|
|
|
| |

|
| |
| Healthcare Strategy |
| Some medical debt to come off credit scores |
| Source: CNBC |
Some medical debt will no longer be included in TransUnion, Equifax, and Experian credit reports come this summer according to a report. This will help many Americans keep their financial health while dealing with surprise or unavoidable medical bills. |
This story from CNBC Select also refers to a very good report from the Consumer Financial Protection Bureau released in February. In that report you'll find quantitative and qualitative insights such as this quote: |
|
“I called and asked for an itemized invoice, trying to understand how 5 minutes with a doctor ... could cost $1500. The response I received was that was the flat rate the hospital charges ... There was no other reason for that amount.”
|
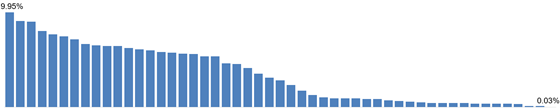
| |
In the report is the portion of the population that has healthcare-related credit notes on their profile. In the report the Right to Work states had an average of 2.65% while the others had an average of 0.80%. The range of values across all states was: |
|
|
Chart created from data in CFPB report
|
| |
We felt like listing the states wasn't necessary. The amounts range from ten percent of the population to almost zero. You can look up your state in the CFPB report Medical Debt Burden in the United States. |
—
Read the full story from CNBC |
| |
|
|
|
|
| |
|
|
| |

|
| |
| Social Media |
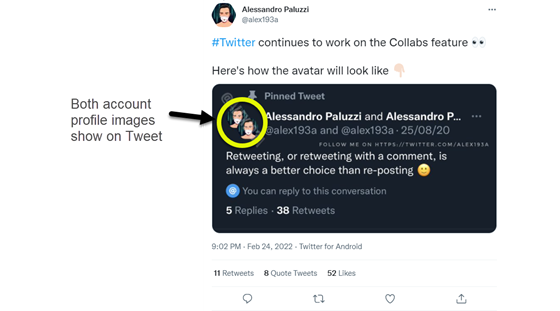
| Twitter experimenting with collaborations |
| Source: Social Media Today |
It looks like Twitter wants to follow Facebook and Instagram by introducing the ability for brands to collaborate with influencers on Tweets. By including both handles on the content brands can leverage the influencer's audience and authenticity for their content. |
|
|
Image adapted for email from Social Media Today source
|
| |
No word on when it might be released for general usage but we'll keep an eye on it. Marketers interested in working with Influencers could use this. |
—
Read the full story from Social Media Today |
| |
|
|
|
|
| |
|
|
| |
|
|
| |